
How to Make Money Trading with Candlestick Charts: Candlestick charts have long been a cornerstone of technical analysis in the financial markets. Their visual simplicity and the wealth of information they provide make them a powerful tool for traders. To make money trading with candlestick charts, one must understand how to read and interpret these charts effectively and utilize them in conjunction with sound trading strategies. In this comprehensive guide, we’ll walk through how to make money trading using candlestick patterns, combining both fundamental insights and tactical approaches.
Understanding the Basics of Candlestick Charts
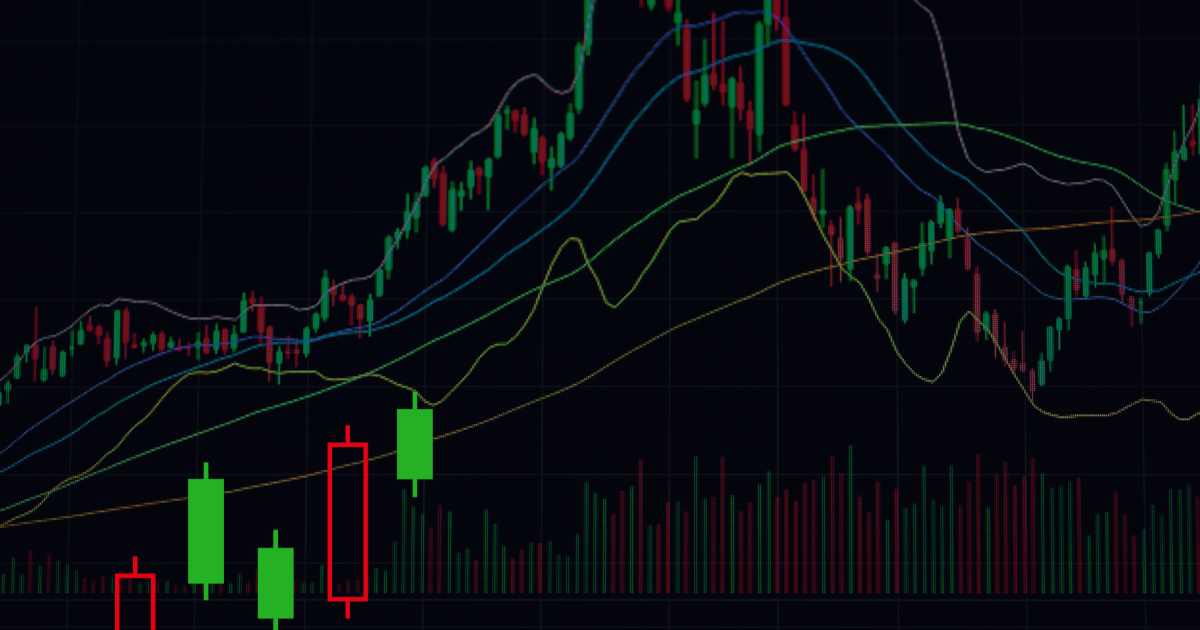
At the heart of successful candlestick trading lies a firm understanding of how these charts function. Each candlestick represents price movement within a specific timeframe, showing four key points of data: the opening price, closing price, high, and low. The body of the candle (the space between the opening and closing price) and the wicks (the vertical lines that represent the high and low) reveal critical insights into market sentiment.
The two basic types of candlesticks are bullish (when the closing price is higher than the opening price) and bearish (when the closing price is lower than the opening price). Recognizing these candles is the first step toward leveraging candlestick patterns for profitable trading.
Importance of Candlestick Patterns in Trading
The real power of candlestick charts lies in the patterns they create. These patterns can signal potential reversals or continuations in the market, offering traders critical decision-making insights. Some patterns, like the hammer, signify a potential bullish reversal, while others, like the shooting star, point to bearish reversals.
Why Traders Rely on Candlestick Patterns
Candlestick patterns provide quick, actionable insights, making them indispensable for day traders, swing traders, and long-term investors alike. These patterns allow traders to:
- Identify trends and potential reversals
- Assess market sentiment through the body and wick size
- Time entries and exits for optimal profit potential
Popular Candlestick Patterns for Profitable Trading
1. The Doji
A Doji forms when the open and close prices are almost identical, creating a very small body. This pattern reflects indecision in the market. Traders look for Doji formations after prolonged uptrends or downtrends as a sign that the current trend may be losing momentum.
There are different types of Doji patterns:
- Neutral Doji: Indicates indecision
- Dragonfly Doji: Signals potential bullish reversal after a downtrend
- Gravestone Doji: Often signals bearish reversal after an uptrend
2. The Hammer and Hanging Man
Both the hammer and hanging man patterns have small bodies with long lower shadows, but their implications differ based on where they appear in the trend.
- Hammer: Appears at the bottom of a downtrend, indicating a potential bullish reversal. The long lower wick suggests that sellers tried to push the price lower but were overpowered by buyers.
- Hanging Man: Found at the top of an uptrend, signaling a potential bearish reversal. It shows that sellers began to take control, despite the strong buying activity.
3. Engulfing Patterns
Engulfing patterns are powerful reversal signals that occur when a larger candlestick completely “engulfs” the previous one.
- Bullish Engulfing: A green candle that engulfs a prior red candle, signaling a bullish reversal.
- Bearish Engulfing: A red candle that engulfs the prior green candle, signaling a bearish reversal.
4. The Morning Star and Evening Star
The morning star and evening star patterns are three-candlestick formations that signal major trend reversals.
- Morning Star: Appears at the bottom of a downtrend. The first candlestick is bearish, the second is a small-bodied candlestick (often a Doji), and the third is a strong bullish candlestick. This pattern indicates a shift from sellers to buyers.
- Evening Star: Found at the top of an uptrend, this pattern is the opposite of the morning star and signals a bearish reversal.
5. The Shooting Star and Inverted Hammer
These patterns share similarities but appear in different contexts.
- Shooting Star: Appears at the top of an uptrend and has a small body with a long upper wick, indicating a potential bearish reversal.
- Inverted Hammer: Appears at the bottom of a downtrend, signaling a potential bullish reversal with a similar long upper wick but found in a downtrend.
Using Candlestick Patterns with Support and Resistance Levels
While candlestick patterns can provide valuable insights, they are even more effective when combined with support and resistance levels. Support represents a price level where a stock or asset tends to find buying interest, preventing it from falling further. Resistance represents a price level where selling interest typically emerges, capping the upward movement.
By pairing candlestick patterns with these levels, traders can identify potential entry and exit points. For instance, if a bullish engulfing pattern appears at a support level, it could be a strong buy signal. On the contrary, if a bearish reversal pattern forms near resistance, it could indicate an opportunity to short the asset.
Strategies to Profit from Candlestick Patterns
1. Trend Reversal Trading
One of the most effective ways to make money with candlestick charts is to capitalize on trend reversals. Patterns like the hammer, shooting star, engulfing, and morning/evening star offer clear signals of potential reversals.
How to Trade Reversals:
- Identify the pattern: Look for strong reversal patterns, especially after prolonged trends.
- Confirm with indicators: Use indicators like the Relative Strength Index (RSI) or Moving Averages to confirm the trend reversal.
- Place your trade: Enter the market once the reversal pattern is confirmed, and set a stop-loss below (for bullish reversals) or above (for bearish reversals) the pattern to manage risk.
2. Support and Resistance Zones
Candlestick patterns are particularly effective when combined with support and resistance levels. These levels indicate price zones where the market tends to react, and candlestick patterns can help predict the next move.
How to Trade with Support and Resistance:
- Mark key levels: Identify strong support or resistance zones on the chart.
- Watch for candlestick patterns: Look for patterns like Doji, hammer, or engulfing near these levels, signaling potential reversals.
- Execute the trade: Enter the market once a confirming pattern appears, using the support or resistance level as your stop-loss zone.
3. Breakout Trading
Breakout trading involves identifying consolidation patterns, such as triangles, flags, or rectangles, and waiting for a breakout. Candlestick charts provide the precision needed to detect a breakout with confidence.
How to Trade Breakouts:
- Identify consolidation zones: Look for price consolidation where the market is trading within a tight range.
- Monitor candlesticks: Wait for a strong candlestick close outside the consolidation zone, confirming the breakout.
- Set your target: Measure the height of the consolidation pattern and project it in the direction of the breakout to set your profit target.
4. Scalping with Candlestick Patterns
Scalping involves making multiple trades throughout the day, aiming for small, quick profits. Candlestick patterns are ideal for this strategy, as they provide rapid feedback on market sentiment.
How to Scalp with Candlesticks:
- Focus on key patterns: Use quick, identifiable patterns like the Doji, hammer, or engulfing for scalping opportunities.
- Utilize short timeframes: Use 1-minute to 5-minute charts to find intraday patterns.
- Quick entry and exit: Enter the market as soon as the pattern is confirmed and exit once your profit target is reached. Tight stop-losses are essential for this high-risk strategy.
Risk Management: The Key to Consistent Profits
While candlestick patterns offer great insights, risk management is crucial for long-term profitability. Every trade should have a predefined stop-loss and take-profit level. This ensures that emotions do not drive decision-making, and losses are kept in check.
Best Practices for Risk Management:
- Never risk more than 1-2% of your account on a single trade.
- Use trailing stop-losses to lock in profits during strong trends.
- Diversify your trades across different assets to mitigate risk.
Conclusion: Mastering Candlestick Charts for Profit
By mastering the analysis of candlestick charts and combining this knowledge with effective risk management strategies, traders can significantly enhance their chances of success. Whether you are trading reversals, breakouts, or support/resistance levels, candlestick patterns provide a powerful tool for timing entries and exits.
The key to making money lies in consistently identifying high-probability patterns and managing risk appropriately. As you refine your skills, candlestick trading can become a cornerstone of your profitable trading strategy.

